
An infographic allows you to choose to input text and visuals that distill complex and/or important information into simple visual forms.
Usage, Best Practice, and Accessibility
Examples
Infographic Group of Two
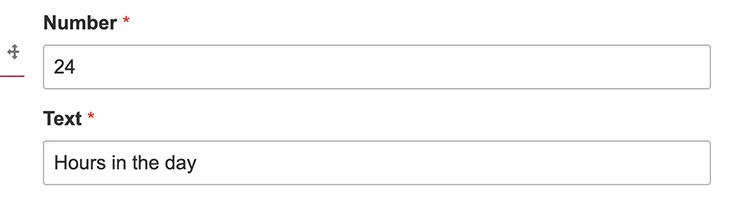
24
Hours in the day
365
Days in the year
Infographic Group of Three
7
Ranked research university
15
Schools in the Big 10
6
Is one more than five
Infographic - Plain
1,234
Books on the shelf
24
Trips to the library
1
Library card
Usage
- After creating and publishing a page, click on the layout button. This will allow you to design and edit the layout of the page.

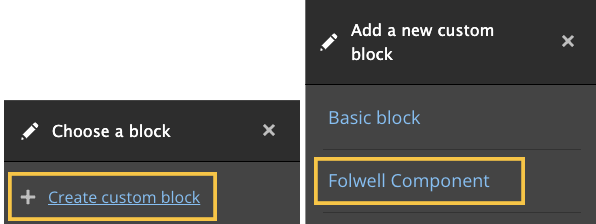
- Scroll down on the page and click on “Add Block”, and a navigation will pop up on the side. From there click “Create Custom Block” and then click “Folwell Component”.
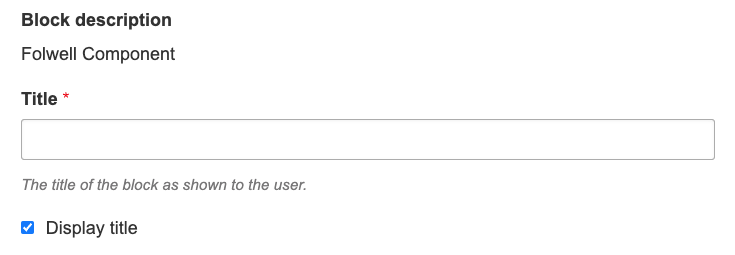
- From here add a title to the Folwell components, although you have the option to hide or display the title on the page.
- Select “Add Folwell Infographic Group” as the Folwell Component you want to add from the dropdown list of components. From there select “Add block”.
- From here add a title to the Folwell components, although you have the option to hide or display the title on the page.
Step 2 - Customizing the Infographic
- In the “Intro Text” text area, add the text as an introduction for the button group. This is an optional field.
- Scroll down and add the information you want to display in the Number and Text fields.
- In order to add more information to the infographic, scroll down and click “Add Infographic Item.” This will add another set of Number and Text fields.

- Choose the infographic style by clicking on the "Infographic Style" dropdown box.

- Once you have customized your infographic to your liking, scroll all the way down and click the “Add Block” button to add the infographic component to the page.
Best Practices
- Design accessibility into infographics to ensure the content is recognizable to screen readers. See Accessibility content for more information.
- Text should be clear and easy to understand for maximum reader comprehension
- If there are links in an infographic, the link text must clearly describe where the link is going to take a user. *links in an image infographic are not accessible.
- Infographics are meant to distill important and sometimes complex information into simple visual form. As such, color should be used sparingly to highlight only key information. Be sure there is enough color contrast between the foreground content and background content.
- Structure: Infographics should have a logical structure. This may include titles and heading levels, consistent colors, a flow that is linear and easy to follow – ie: 3 infographics aligned next to each other
Accessibility
- Contrast high enough for background colors, fonts, and lines
- Screen readers and other adaptive technologies able to identify the component as an infographic, read the text and link (if any), and access link
- Image-based infographics require use of alt text in the form of a transcript (full text description) that can be hidden behind, below, or linked from the image. When possible, create image-based infographics using HTML and CSS. HTML/CSS infographics embed the infographic content directly on a webpage. If the HTML and CSS are developed using custom codes to include accessibility, then the infographic becomes accessible to screen readers.